1 Where we live

The U.S. Census
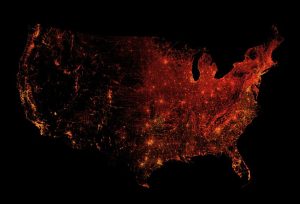
We will start this project by using U.S. Census data to learn about where we live. The U.S. Census attempts to provide an accurate count of the number of people in the United States every ten years. The collection of the U.S. Census data is required by the U.S. Constitution to determine political representation in the United States House of Representatives. So, every ten years, starting in 1790, census data is gathered. The last formal census was conducted in 2020. Since you are using data collected for another purpose, the U.S. Census, this project provides you with an example of secondary data analysis. You are using data collected by someone else (the U.S. Census), to learn about the racial demographics of where you live. Before we delve into your zip code, let’s take a look at racial categories in the Census over time.
Racial categorization in the U..S. Census
You might find it interesting to see the different ways that the Census has categorized race from 1790-2020. The link provided will allow you to click on a year and a racial category.
- What do you notice about changes in the racial categories over time?
- What do the categorizations reveal about the construction of race in the United States at different points in history?
Racial demographics of where you live: comparing specific census tract, Oregon, and the United States
Now, let’s move on to looking at data for your census tract and compare it to Oregon and United States
- First click
- My Community Explorer (please give the map time to load)
- Click on “Go to application”
- Click on the layers (looks like sheets of paper on top of one another in a box on the upper-right of the screen), and deselect “Emergency Preparedness Layers” and “Community Resilience Estimates 2021”
- Select “Race and Ethnicity”
- Make sure that the “Cartography and Info Layers” is selected
- Select a state by clicking on the “Select a state” box at the top of the screen and then use the drop-down menu to select “Oregon”
- Zoom in to the area where you live. The closer you zoom into your location, the more details of the geography will appear.
- Zoom in further to a more specific geography that includes your Census tract number (the Census will divide locations by census tract numbers). Continue to zoom in until you recognize the geographic markers of the area where you live such as street numbers.
- Click on the information for your census tract geography (wait for the map to load)
- Go back to the layers box and select “Race and Ethnicity”
- You will notice that a table opens on the left portion of the screen. Click on the link labeled “View Detailed Report – Link Via Census Business Builder”
- Click on each racial category and you will notice a chart showing the data for your zip code in comparison to Oregon and the U.S.
- What do you notice about the racial categories in your census tract compared to Oregon and the U.S.?
- Are there particular racial categories that are higher and lower in your Census tract compared to Oregon and the U.S?
- You may also notice the comparisons of median income, average salary, poverty rate, educational attainment, and languages spoken at home.
In the next section, you will learn about the ways that racial discrimination has impacted racial demographics in Oregon. Now that you know what the racial demographics are for your census tract, we will turn to the question: why does my community have the racial demographics that are reported in the Census data?

