4 Immigration history
How Immigrants Shaped the United States
The history of immigration is tied to the social construction of racial inequality in the United States. In 1795, the U.S. government restricted citizenship to free-born whites who: declared loyalty, lived in the United States for two years and satisfied the government they were of good character, would make positive contributions to the country, and supported the principles of the U.S. Constitution. Those who were non-white were not eligible for citizenship, and therefore not allowed to vote, serve on juries, benefit from equal protection of the laws. It was not until the end of the Civil War and passage of the Fourteenth Amendment to the U.S. Constitution that citizenship was extended to anyone born in the United States. While federal law trumps state law with respect to constitutional issues, and Oregon ratified the 14th Amendment in 1866, it was rescinded in 1868 and not ratified again until 1973. By the way, the 15th Amendment which guaranteed the right to vote regardless of race, was not ratified in Oregon until 1959, 100 years after the state was formed.
The Treaty of Guadalupe-Hidalgo in 1848 ended the war between the U.S. and Mexico. The U.S. gained tremendous territory from Mexico, the entire Southwestern portion of the U.S. As a part of treaty agreement, Mexicans who lived on the land that was now part of the U.S. were defined as citizens, and as white by implication. Nonetheless, there were many efforts to define Mexicans as non-white. Mexican migrants arrived in the U.S. in large numbers in the 1910s and 1920s. Brutal policies including a “Repatriation” program in the 1930s rounded up citizens and non-citizens alike of Mexican ancestry, forcibly removing them to Mexico. At times when labor was needed in the U.S. Mexicans were recruited to work, for example during WWII the Bracero Program encouraged Mexican migration providing temporary work visas. At other times, for example after WWII, Mexican Americans have experienced brutal discriminatory policies with respect to immigration. “Operation Wetback” in 1954 rounded up as many as 1.2 people of Mexican decent and deported them. In the current era, mass deportations are again a concern.
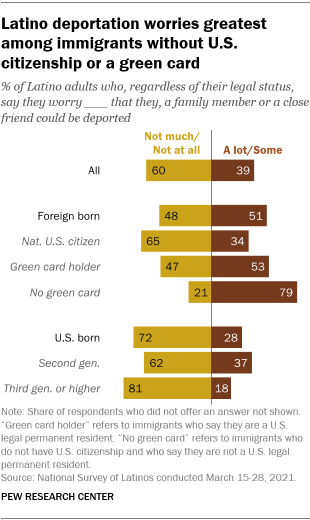
“Around four-in-ten Latinos in U.S. worry they or someone close to them could be deported” Pew research Center, Washington, D.C. (February 14, 2022)
Immigrants have often been scapegoated, meaning that they have been blamed for things that they are not responsible for such as economic downturns. This is particularly strong during times of high migration rates and economic distress for working-class men, which have led to exclusion movements. These movements have sometimes resulted in laws that limited entry to the U.S. at all. For example, Chinese immigrant laborers were banned from entry to the U.S. with the 1882 Chinese Exclusion Act. Often, the white working class worked to exclude immigrants who they felt would undercut their pay. Racial hatred and violence was a tactic used against immigrant groups in addition to legal policies restricting immigration. For example, in Portland, in 1883 hate group members raided half a dozen Chinese farming settlements near where PGE park sits today. Chinese immigrants were also terrorized in Mt Tabor and Oregon City. Chinese residents of Tacoma, Washington were forced from their homes in 1885. Perhaps the worst example of violence was the massacre of 31 Chinese gold miners working in Hell’s Canyon on the Snake river in 1887.
Alien Land laws prohibited immigrants ineligible for citizenship (non-whites) from land ownership in some states were passed in the early 1920s (California, Oregon, Florida, Washington, Texas, Minnesota, Nebraska, Utah, and Wyoming). The Supreme Court did not rule that the laws were an unconstitutional violation of the Fourteenth Amendment of the U.S. Constitution until 1952.
A large wave of Southern and Eastern European immigration at the turn of the 20th Century led to a highly restrictive quota system that favored national origins of Northern Europeans. Southern and Eastern Europeans were sometimes defined as non-white. The restrictive legislation started with the Emergency Quota Act of 1921 and culminated in the Johnson-Reed Act of 1924. Johnson-Reed limited total immigration and based the quota for nationality based on 2% of the nationality in the 1790 U.S. Census (prior to the arrival of Eastern and Southern Europeans), along with maintenance of Asian exclusion. This severe restriction was not changed until 1965. The proportion of Americans who are first-generation immigrants was severely impacted by both the 1924 restrictions and 1965 policy. In 1965 a massive change in immigration law cut out racially discriminatory policies and prioritized family reunification in naturalization permits. 1986 brought on another very important piece of immigration law that was designed to crack down on employers who employed undocumented immigrants, but also provided opportunities for permanent legal status and naturalization for undocumented immigrants who arrived in the U.S. prior to 1982. This policy was later extended to spouses and children of those who had gained permanent resident status. From the 1970s -1990s, immigration policy expanded for refugees fleeing war and extreme violence in their home countries. Violence against women also became a criteria for refugee status in the U.S. As a result, the U.S. foreign born share of the population has grown and is now about 14% of the U.S. population.
")
Permanent resident immigration policy prioritizes worker permits for people with high levels of education and highly specialized skills needed by U.S. employers. A separate set of programs grants temporary legal status to international students studying at U.S. universities, and temporary workers sponsored by employers.
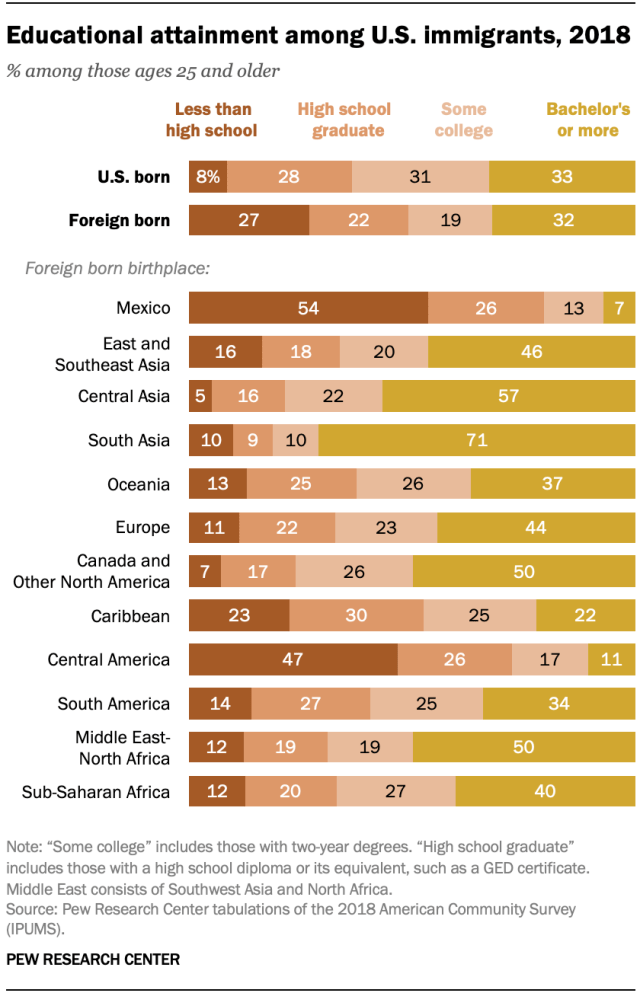
“Key findings about U.S. Immigrants”, PEW Research Center, Washington, D.C. (August 19, 2020)
You may find that the demographics of where you live reflect the growth of immigrant populations in recent decades. For example, as the Oregon Department of Economic Analysis points out, approximately 2% of Oregon’s population identified as “Hispanic or Latino” in the 1980 Census, but by 2020, 14% of Oregonians did so. The office also points out that the proportion of people identifying as Hispanic and Latino in Oregon varies by location. Please click on the link to view the map created by the Oregon Department of Economic Analysis.
The Asian population has also grown significantly and is very diverse. As the PEW research center charts below point out, the proportion of Asian Americans will surpass Hispanic and Latinos in the immigrant population in the U.S.
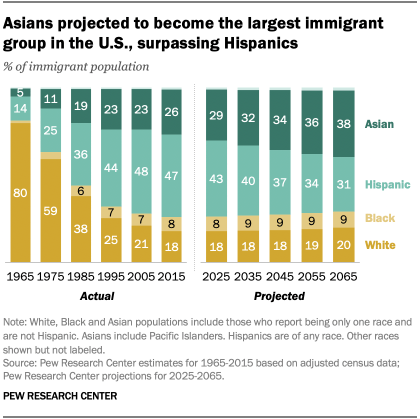
“Key facts about Asian Americans, a diverse and growing population” Pew Research Center, Washington, D.C. (September 8, 2021)
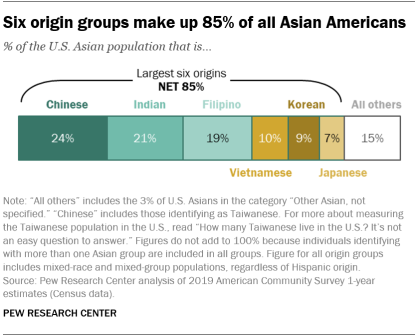
“Key facts about Asian Americans, a diverse and growing population” Pew Research Center, Washington, D.C. (September 8, 2021)
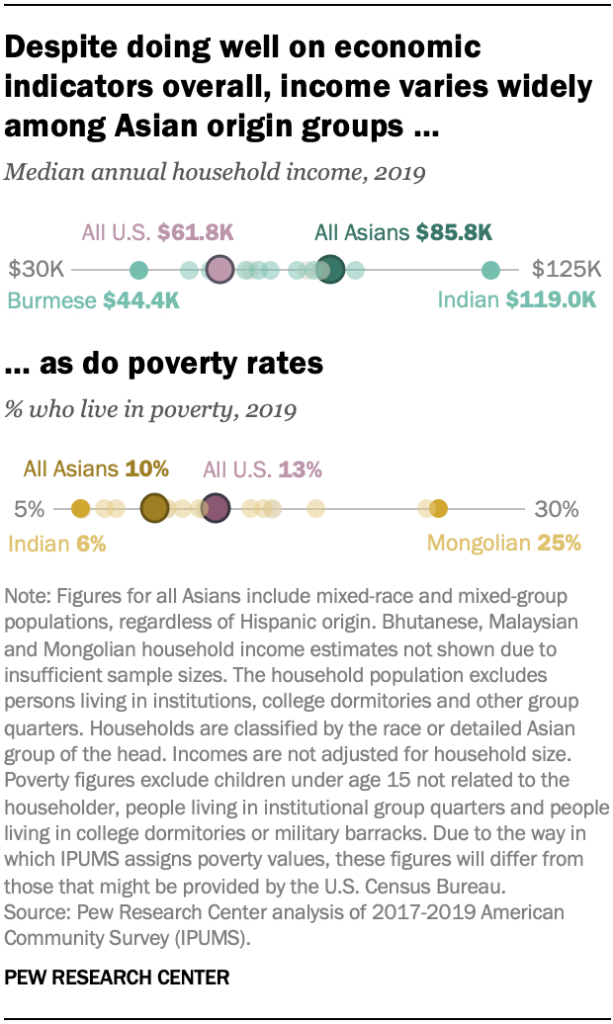
“Key facts about Asian Americans, a diverse and growing population” Pew Research Center, Washington, D.C. (September 8, 2021)
Asian American communities are diverse and are also concentrated in particular geographies. Some Asian Americans have ancestors who have been in the U.S. more than 150 years. Others are likely to have immigrated after 1965 with high levels of education and may be working in specialized fields with high incomes. Other groups may have immigrated as refugees escaping war with few material resources startin gin the 1970s. For more detailed information, please click on the link to view the story maps of Asian and Pacific Islander demographics developed by APANO in 2021, and Census data on Asian and Pacific Islander Communities, published in partnership with APANO Communities United Fund, Insight for Action, and Willamette Partnership April 7, 2022.
In what ways have immigration policies and patterns impacted the racial demographics of your census tract?
